Using the block reader
One of the bottlenecks I’m encountering with the raster API is the cost of using a random access iterator for each cell access. Each time I call the iterator there is a managed to native transition where the c# api calls through to the underlying c++ iterator just to retrieve a single value. At lower zoom levels where the terrain samples are far apart this is hard to avoid. *Also, see a note about format performance in the final post.
At high zoom, however, we should try and take advantage of the fact that our sample points are close together and arranged in a grid. As the terrain tile sample interval approaches the cell size of the underlying grid, it makes more sense to use a block iterator for data access
  private void GetGridBlock(int col, int row, int width, int height, IRasterDataset dataset, out double[] odata, out bool[] ovalid) {
            var iterator = dataset.GetBlockIterator(0, IteratorMode.Read);
            iterator.Begin();
            var bnd = iterator[0];
            byte[] data;
            byte[] valid;
            bnd.GetBlock(col, row, (uint)width, (uint)height, RasterBandDataType.RealDouble, out data, out valid);
            int numCells = data.Length / sizeof(double);
            double[] actualData = new double[numCells];
            bool[] actualValid = new bool[numCells];
            // iterate over each cell in block
            for (int cellIndex = 0; cellIndex < numCells; cellIndex++)
            {
                // convert to required types
                actualData[cellIndex] = BitConverter.ToDouble(data, cellIndex * sizeof(double));
                actualValid[cellIndex] = BitConverter.ToBoolean(valid, cellIndex);
            }

            odata = actualData;
            ovalid = actualValid;

        }
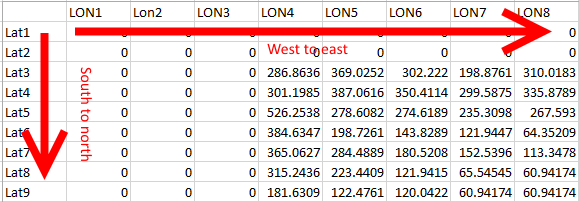
The API is silent on exactly how the data is returned. We’ve requested a tile and it’s returned a linear array. I’d assume the array has the same layout as a normal grid, but it’s a good idea to visualise what it’s returning so we know how to use it.
Here I’m going to use the data envelope from my input grid to export the block as a tsv file.
GetGridBlock(westmost, southmost, width, height, dataset, out actualData, out actualValid);
List<string> lines = new List<string>();
// sample every nth point
            for (int lat = 0; lat < height; lat+=res)
            {
                string thisline = "";
                for (int lon = 0; lon < width; lon+=res)
                {
                    int pos = (width * lat) + lon;
                    thisline += $"{(actualValid[pos] ? actualData[pos] : 0)}\t";
                }
                lines.Add(thisline);
            }
            File.WriteAllLines(outFile, lines);
I’m going to use excel to perform a quick visualisation of the data I output. I’ve used the 3D surface chart type to test my data here.
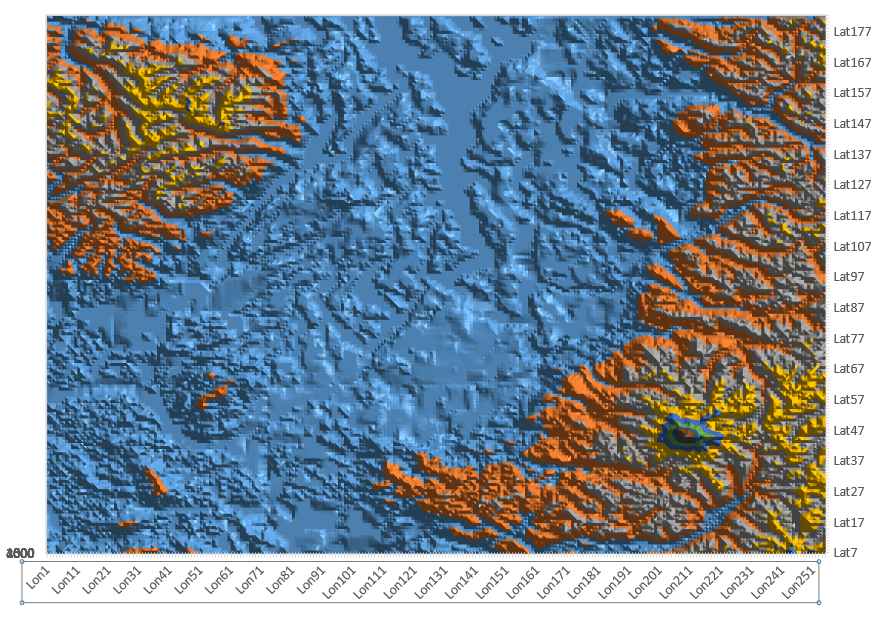
If you have a sensible labelling scheme excel will be able to infer the orientation of your data, so I was able to get the above output with a minimum of fuss. The key takeaway is that our linear array has an origin in the south west and fills easterly, then northerly. This is not a big surprise at all but it’s good to get confirmation. Also it is different from the order expected by cesium, which fills southerly, then easterly.
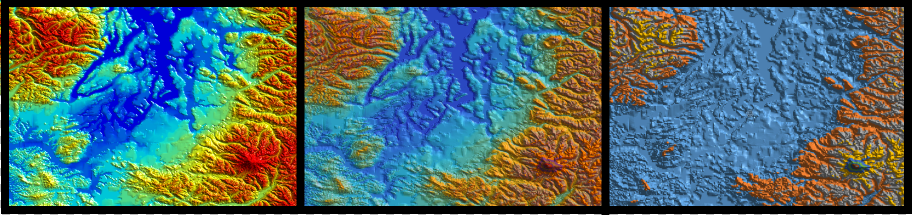
Lining the surface plot up with the render in MapInfo shows that we’ve got things about right.
Now that we have a better idea how block access works we should be able to incorporate it into the terrain tile generator. We have to be mindful of how much data we ask for with the block reader – we won’t always be able to use the tile extents when querying at the base resolution.
 bool useBlock = false;
 //There's a limit on the array-size that can be returned from the block reader
 //so pick a conservative ratio between tile sample width and cell width
 if (tileSample < (sourceSample * 3)) {
   useBlock = true;
  }
When it comes time to create a tile we can use a different method depending on our zoom:
if (useBlock)
 {
     bool created = CreateTileUsingBlockReader(tX, tY, zoom, dataset, terrainTile);
     if (zoom == maxZoom)
     {
         create = created;
     }
 }
 else {
     CreateTile(tX, tY, zoom, dataset, terrainTile);
 }
The main difference from the random iterator version is that we have to convert our lat/lon offsets into block coordinates, and make sure to check the valid array:
//64 samples with one row of overlap with the next tile.
//Hence desired width is 65 tile samples, converted into cell units
var width = (int)Math.Ceiling((dx * 65) / cellSize);
//transform lat and lon into block units
var Y = (int)Math.Round((width / 65.0) * lat, 0);
var X = (int)Math.Round((width / 65.0) * lon, 0);
var place = (width*Y) + X;
if (place >= actualValid.Length) {
    place = actualValid.Length - 1;
}
bool isValid = actualValid[place];
Overall this improvement just about halves the time taken to produce our World_resample tileset:
| Method | Average Time |
| naive | 00:31.9 |
| write saving | 00:23.9 |
| Block @ Max Zoom | 00:12.1 |
In the next post we’ll look at using the overview/underview capabilities of the block reader to improve the quality of the closer zoom levels, and to allow us to use the block iterator at lower zooms.